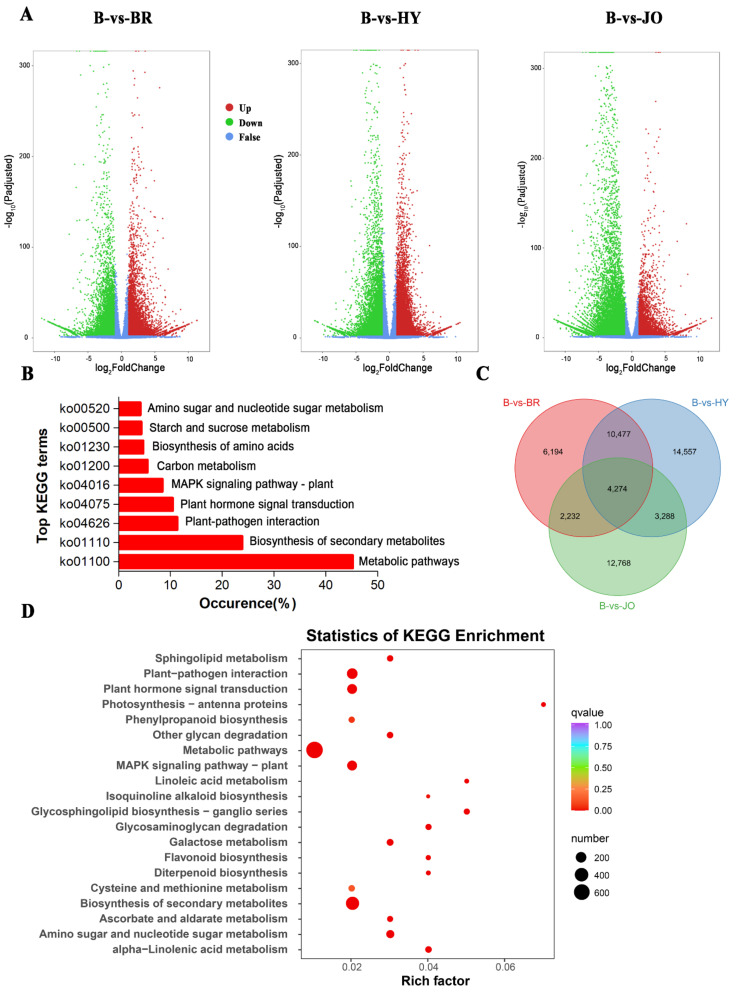
Figure 3.
Differentially expressed unigenes between pod skins of the green and purple okra (B vs. BR, B vs. HY, and B vs. JO). (A) Volcano plots displaying the up−regulated, down−regulated, and no−regulated genes of the three compared groups. (B) Top KEGG terms contributed by all the differentially expressed unigenes. (C) Venn diagram showing the shared and the unique differentially expressed unigenes across the three compared groups of okra pods. (D) The top 20 of KEGG enrichment of the 4,274 differentially expressed unigenes shared by the three compared groups.

