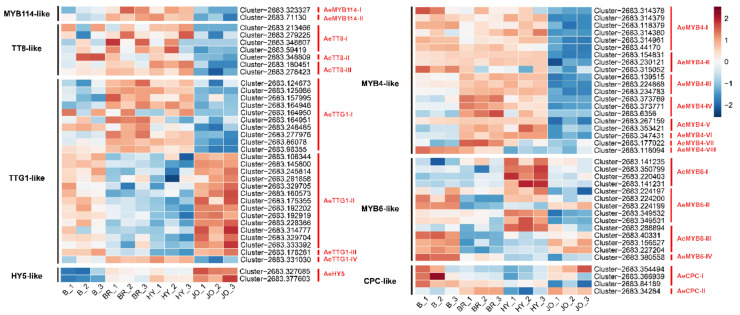
Figure 6.
Heat map of the expression levels of the regulatory factors directly regulating anthocyanin biosynthesis in pod skins of the four okra cultivars. The FPKM values, log2-transformed, were used to generate the heat map. The blue color indicates low expression; red represents high abundance of expression.

