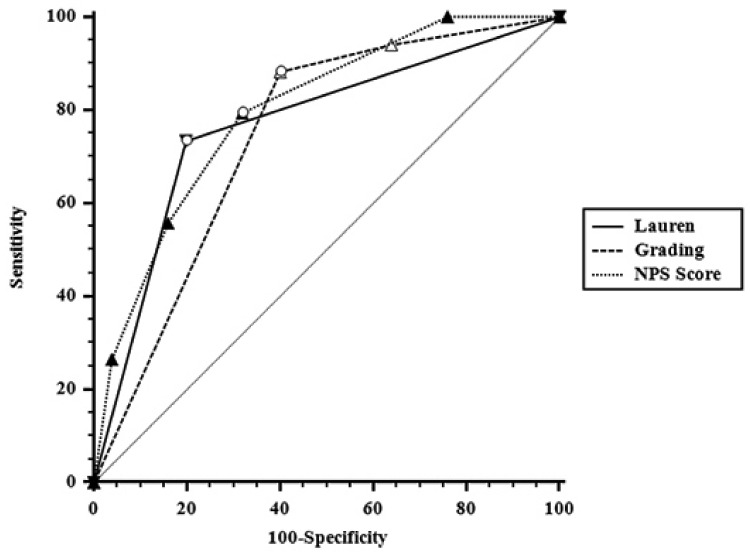
Figure 1.
Comparison of three receiver operating characteristics (ROC) curves referred to Lauren’s classification, tumor grade, and NPS score towards tumor grade regression. The analysis offers a complete sensitivity/specificity report and a graph that plots the true positive rate in function of the false positive rate at different cut-off points. The line for each factor is far away from the diagonal, and there were no differences in the area under the curve among the three factors (Lauren vs. tumor grade p = 0.7881; Lauren vs. NPS score p = 0.7096; tumor grade vs. NPS score p = 0.5535).

