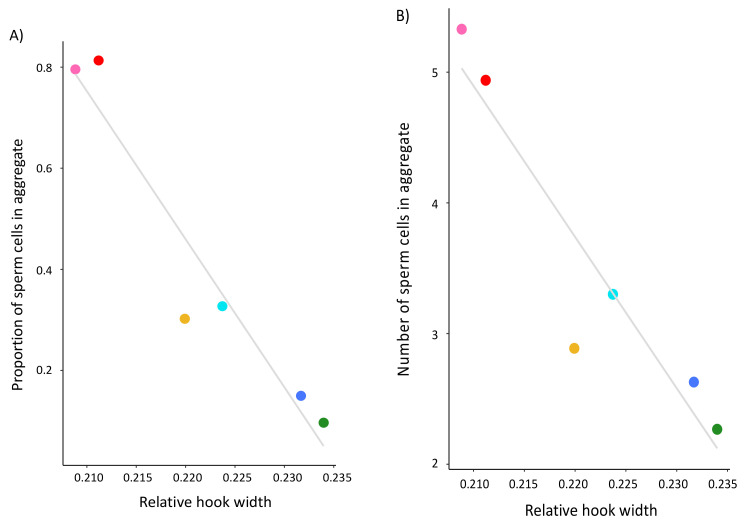
Figure 3.
Mean width of the apical sperm hook negatively associates with the frequency (A) and size (B) of sperm aggregates produced within six species of Peromyscus mice. Statistical analyses were conducted using a PGLS to control for phylogenetic relationships with the regressions, which are indicated by a line in gray. In both panels, species are indicated by the same color patterns from Figure 2. Note truncated y-axes.

