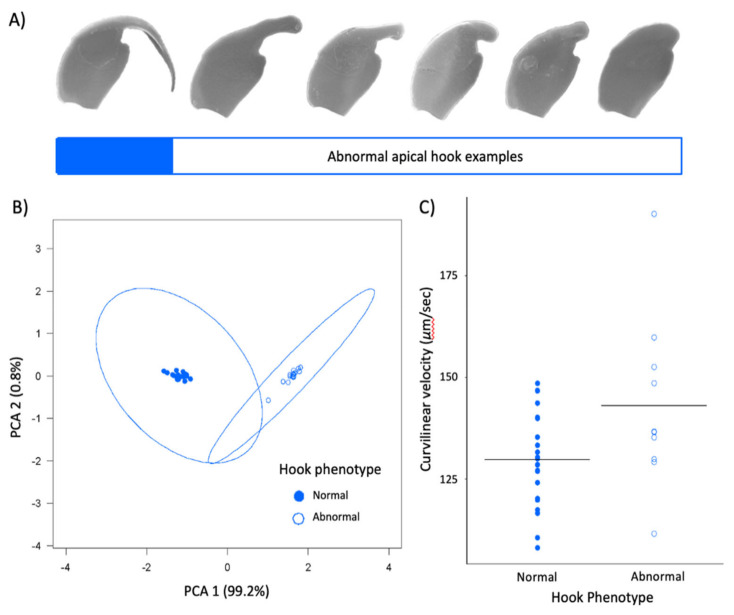
Figure 5.
Apical hook variation in P. leucopus colony. (A) Example scanning electron micrographs of sperm with normal hooks (solid blue) and range of abnormal hook phenotypes (white). (B) When hook length and area are reduced to principal components, two discrete categories of males are formed based. Dots denote individual males, circles represent 95% confidence intervals. (C) Sperm with normal hooks (blue) are slower than those with abnormal hooks (white). Circles represent mean value for each male, and black lines represent group mean. Note truncated y-axes.

