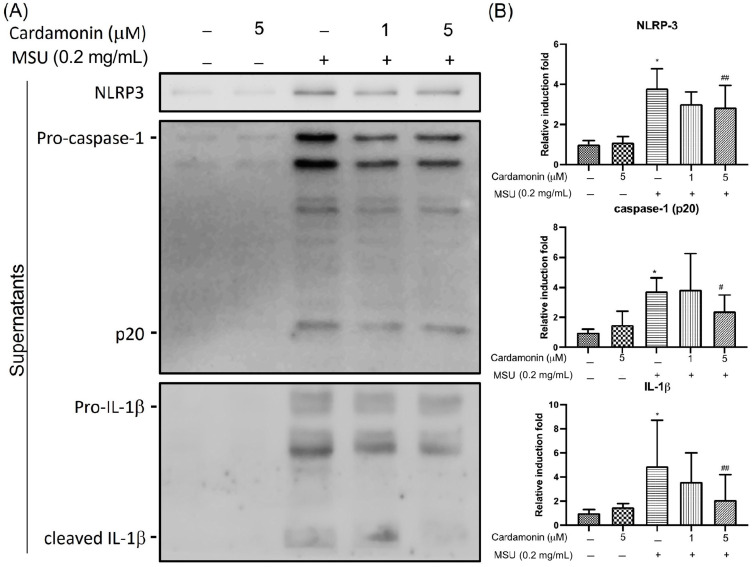
Figure 2.
Effects of cardamonin on MSU-stimulated NLRP3 inflammasome activation in J774A.1 macrophage cells treated with MSU for 6 h in the presence or absence of cardamonin: (A) Representative gel showing the effect of cardamonin on MSU-stimulated cells. (B) Western blot analysis used to detect levels of NLRP3, caspase-1, and IL-1β in supernatants. (–) not treatment; (+) treatment. Each value represents the mean ± SD. Statistical differences among the MSU groups were compared against the control values, whereas cardamonin groups were compared against the MSU group using the ANOVA test (n = 5; * p < 0.05 vs. control; # p < 0.05 vs. MSU; ## p < 0.01 vs. MSU).

