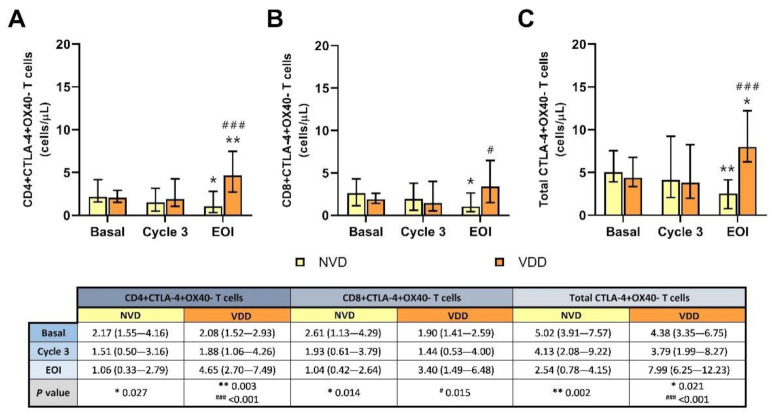
Figure 6.
Circulating CTLA-4+OX40- T cell concentration according to normal vitamin D (NVD) levels and vitamin D deficiency (VDD) in basal, cycle 3 and end of induction (EOI). (A): CD4+; (B): CD8+; (C): total T cells. * and **, statistically significant differences compared with basal (p ≤ 0.05 and p ≤ 0.01, respectively). # and ###, statistically significant differences compared with NVD (p ≤ 0.05 and p ≤ 0.001, respectively).

