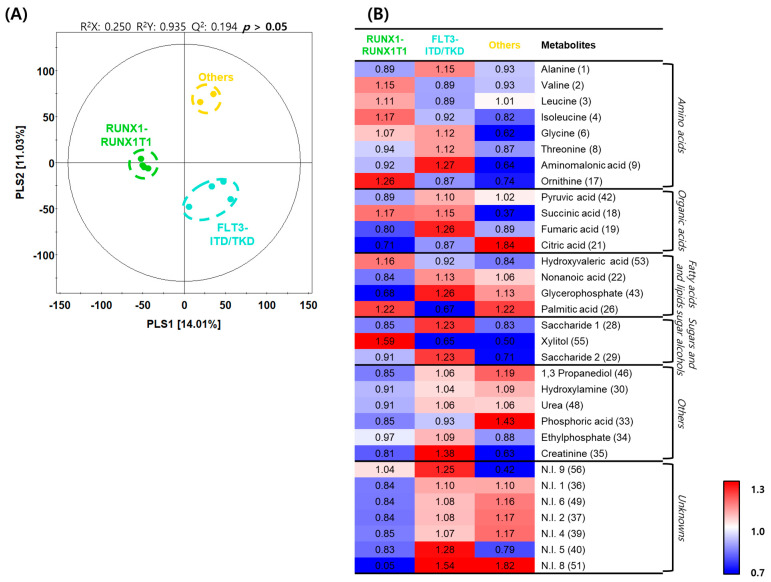
Figure 4.
Differences in metabolite profiles based on genetic aberrations in acute myeloid leukemia. (A) Partial least squares–discriminant analysis (PLS–DA) score plots constructed using data from gas chromatography–time of flight–mass spectrometry analysis of the initial diagnosis patient subgroups. Green dots, RUNX1-RUNX1T1 group; light blue dots, Fms-like tyrosine kinase 3 (FLT3)-internal tandem duplication (ITD)/tyrosine kinase domain (TKD) group; and yellow dots, others group. (B) Heatmap analysis representing differential metabolites among the initial diagnosis subgroups with relative metabolite abundance. The relative level in the heatmap represents fold changes normalized to the average level of each metabolite. The color scheme is as follows: lower limit value (0.7), blue; middle value (1.0), white; and upper limit value (1.3), red.

