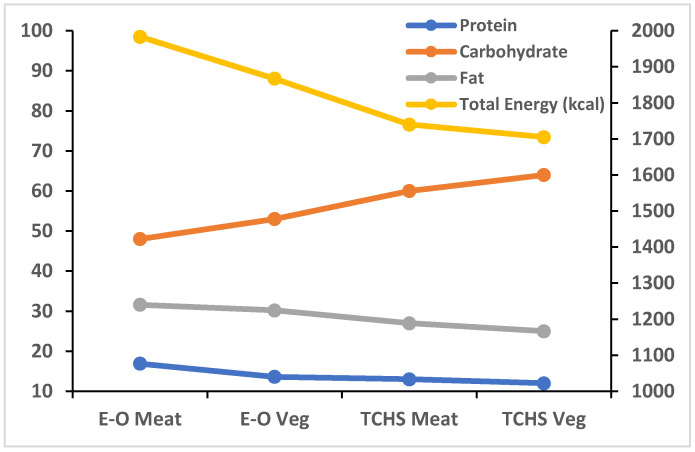
Figure 1.
Comparison of the nutrient intakes in different diet groups of the EPIC-Oxford (E-O) and cohort 1 of the Taiwanese (TCHS) studies X-axis: Diet group; Y-axis (right): Total energy intake in kcal; Y-axis (left): Nutrient intake as percentage of total energy intake; Meat = Meat-eater; Veg = Vegetarian.

