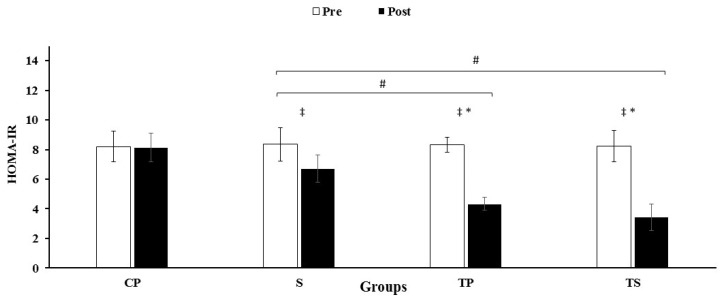
Figure 5.
Pre and post training values (mean ± SD) for HOMA-IR in CP, Control–Placebo; S: Supplement; TP, Training–Placebo; TS, Training–Supplement groups. * indicates significant differences with control group (p < 0.05). * indicates significant differences compared to the control group (p < 0.05). # indicated significant differences compared to S group (p < 0.05). ‡ indicated significant difference from baseline (p < 0.05).

