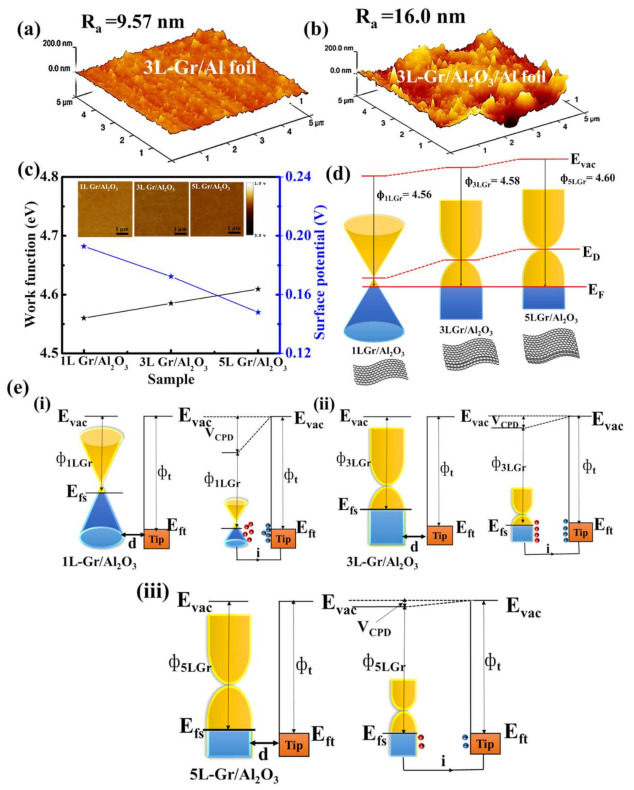
Figure 4.
3D AFM images of (a) 3L-Gr/Al-foil/PET substrate and (b) 3L-Gr/Al2O3/Al-foil/PET substrate. (c) Work function measurements of 1L-, 3L- and 5L-Gr on the Al2O3/Al-foil substrate by KPFM. Inset showing the surface potential of graphene layers (1L, 3L and 5L) over Al2O3. Schematic illustration of (d) energy band diagrams for 1L-Gr, 3L-Gr and 5L-Gr over Al2O3. (e) Electronic energy levels of graphene samples and AFM tip without and with electrical contact for three cases: (i) tip and the 1L-Gr over Al2O3/Al-foil/PET, (ii) tip and the 3L-Gr over Al2O3/Al-foil/PET and (iii) tip and the 5L-Gr over Al2O3/Al-foil/PET. Evac is the vacuum energy level. Efs and Eft are Fermi energy levels of the graphene sample and tip, respectively. VCPD is the contact potential difference, and ΦnGr and ϕt are work functions of the graphene layer (n = 1, 3 and 5) and tip, respectively.

