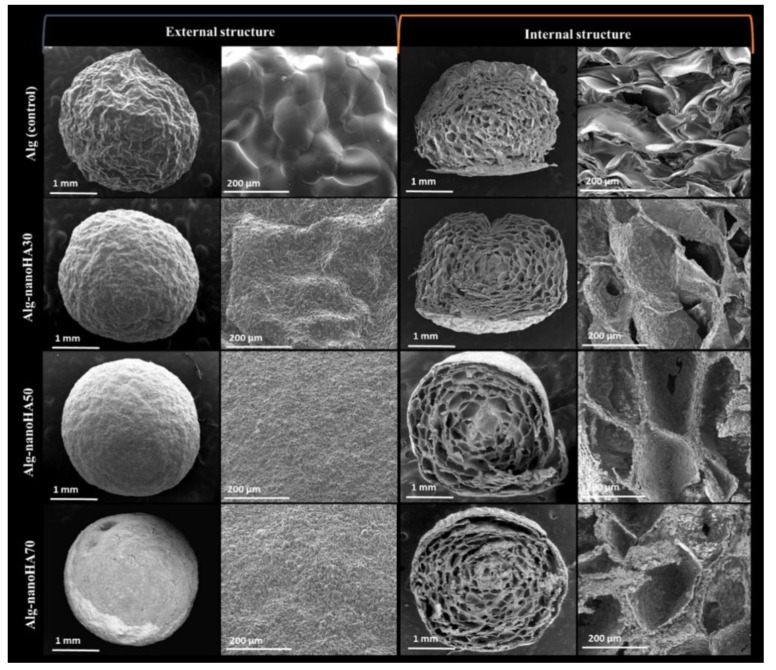
Figure 8.
SEM images of ALGH-HAP beads with increasing HAP content (top to bottom), showing the external structure (left) and internal structure (right) at different magnifications. Note the increasing roughness as the HAP content increases [136]. Used with permission. Copyright Elsevier 2019.

