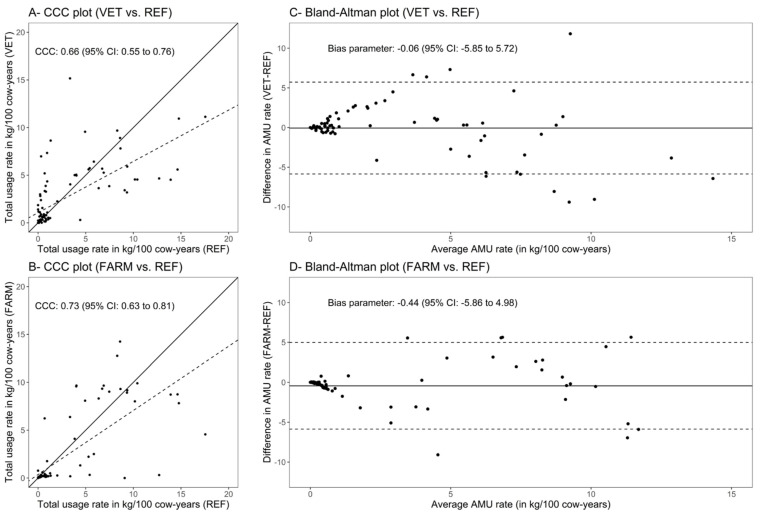
Figure 2.
Concordance correlation coefficient (CCC) plots showing strength of association for quantification of total usage rate of antimicrobials (in kilograms /100 cow-years) between the reference method REF and methods VET (Plot A) or FARM (Plot B). The solid line represents the line of perfect concordance; the dashed line represents the reduced major axis. Bland–Altman plots showing agreement in quantification of total usage rate of antimicrobials (in kilograms/100 cow-years) between the reference method REF and methods VET (Plot C) or FARM (Plot D). The solid line represents the mean difference (estimated bias); dashed lines represent the 95% limits of agreement.

