Figure 1.
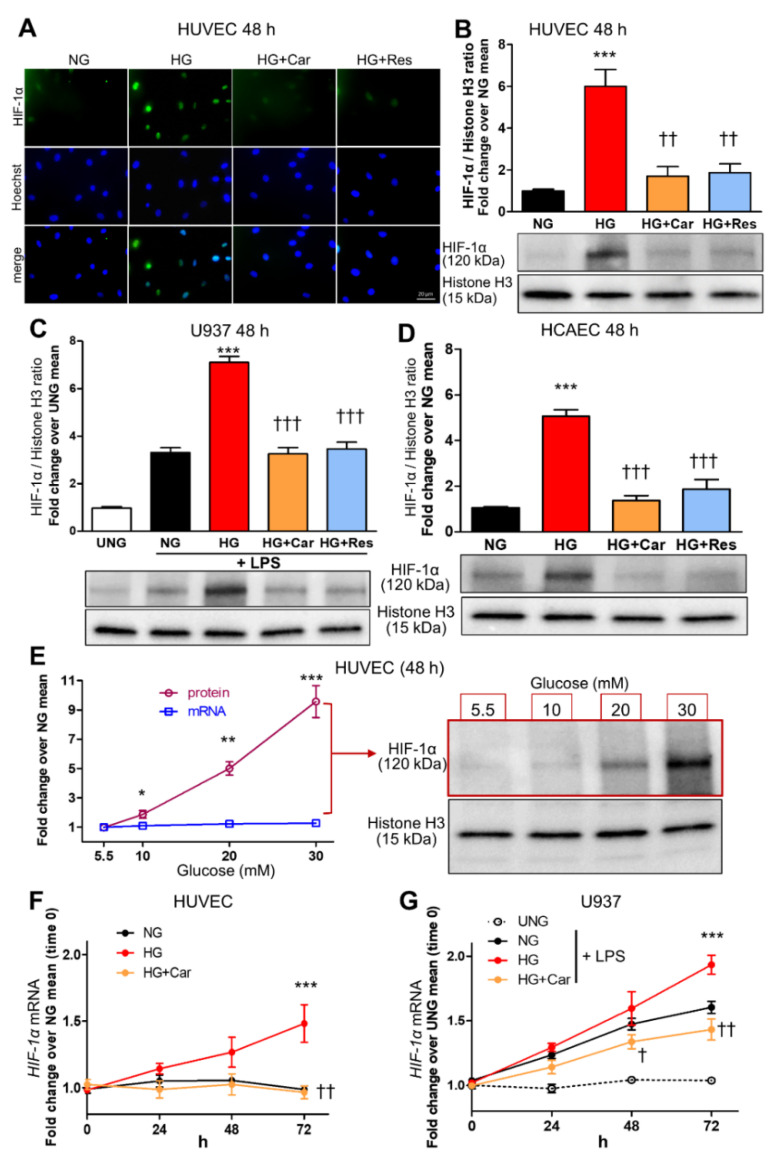
HG increases HIF-1α nuclear translocation in endothelial cells and LPS-stimulated macrophages. Representative IF ((A), scale bar 20 µm) and Western blot (B) for nuclear HIF-1α in HUVEC exposed to HG (20 mM) vs. NG (5.5 mM) for 48 h, with or without the carbonyl trapping agent Car (20 mM) or the glyoxalase inducer Res (10 µM), and relative band densitometry analysis from three separate experiments. Western blot analysis for nuclear HIF-1α in U937 cells stimulated (or not, UNG = untreated NG) with LPS (10 ng/mL) (C), and HCAEC (D), after 48 h incubation with HG vs. NG with or without Car or Res, and relative band densitometry analysis from three separate experiments. Dose response curve (E) of nuclear HIF-1α protein levels (n = 3 separate experiments per condition, black line) and mRNA HIF-1α expression (n = 5 wells in duplicate per condition, blue line) in HUVEC exposed to varying concentrations of glucose ranging from 5,5 mM to 30 mM for 48 h, and representative Western blot image (right side of panel (E)). Time course of HIF-1α mRNA expression in HUVEC (F) and U937 cells stimulated (or not, UNG) with LPS (G), exposed to HG vs. NG for different times ranging from 0 to 72 h, with or without Car; n = 5 wells in duplicate per time point per condition. Bars represent mean ± SEM. Post hoc multiple comparison: *** p < 0.001, ** p < 0.01 or * p < 0.05 vs. NG; ††† p < 0.001, †† p < 0.01 or † p < 0.05 vs. HG.

