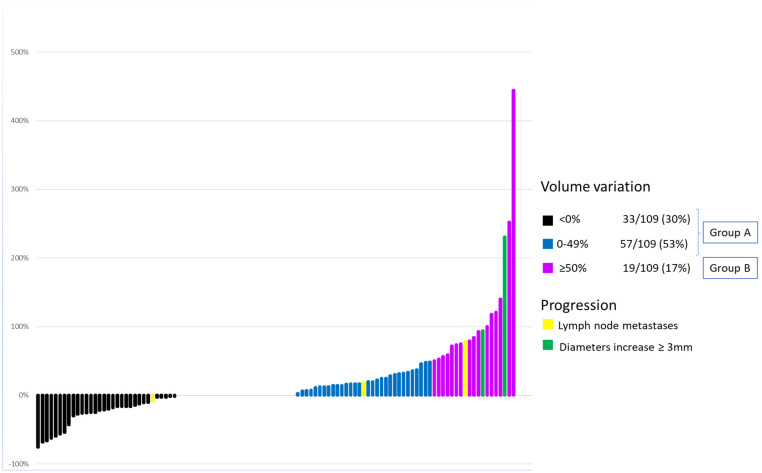
Figure 1.
Each line expresses the extent of the volumetric variation of mPTC at the last check with respect to enrollment. Yellow and green lines represent the mPTC that have developed clinical progression during observation according to protocol criteria. Green lines identify the 2 mPTC that showed a ≥3 mm increase in each diameter. Yellow lines identify the 5 mPTC that have developed lymph node metastases.

