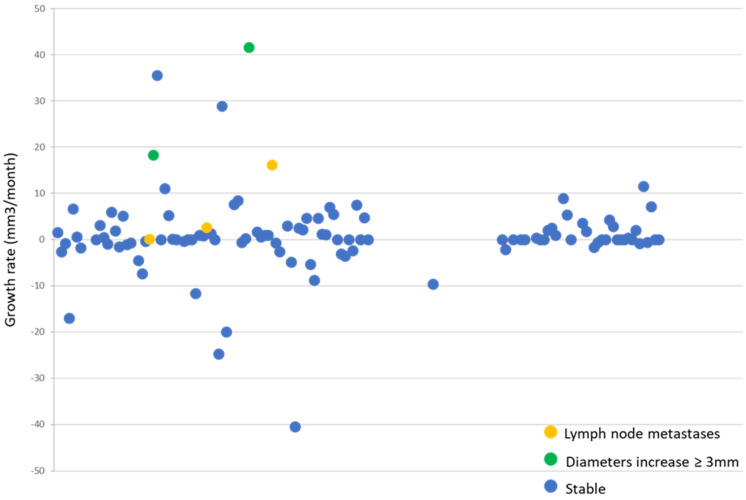
Figure 3.
Each dot corresponds to a patient. The growth rate is expressed on the ordinates axis. The green dots represent the progressing mPTC patients by each diameters increase >3 mm, the yellow ones represent the progressing mPTC who developed lymph node metastases and the blue ones represent the stable mPTC patients. The mean growth rate is near 0 mm3/month. The green dots have the fastest growth rate, the yellow ones have variable behavior in tumor growth and the blue ones have the slowest growth rate.

