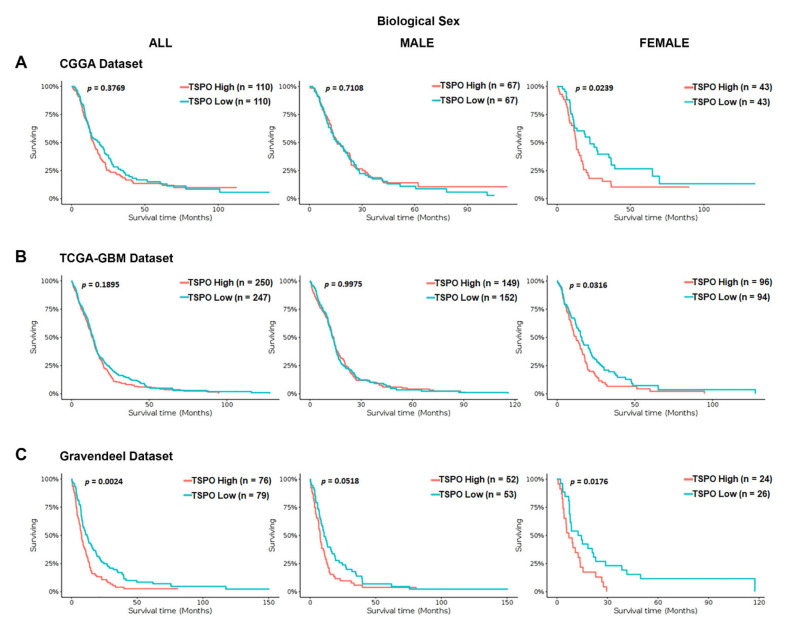
Figure 2.
Kaplan–Meier survival curves of TSPO mRNA expression in GBM patients stratified by biological sex using the CGGA, TCGA-GBM, and Gravendeel datasets. Overall survival of GBM patients with a high or low expression of TSPO, using the median as the cutoff value, was analyzed using the (A) CGGA database, (B) the TCGA-GBM database (Affymetrix HG-U133A platform), and (C) Gravendeel database, available at GlioVis data portal. Survival curves analysis were stratified by biological sex, including the entire population (left panel), male population (middle panel), and the female population (right panel) for the three independent databases. Genotype patient numbers and p-values are indicated in each graph, and the median and statistical data are in Table S1.

