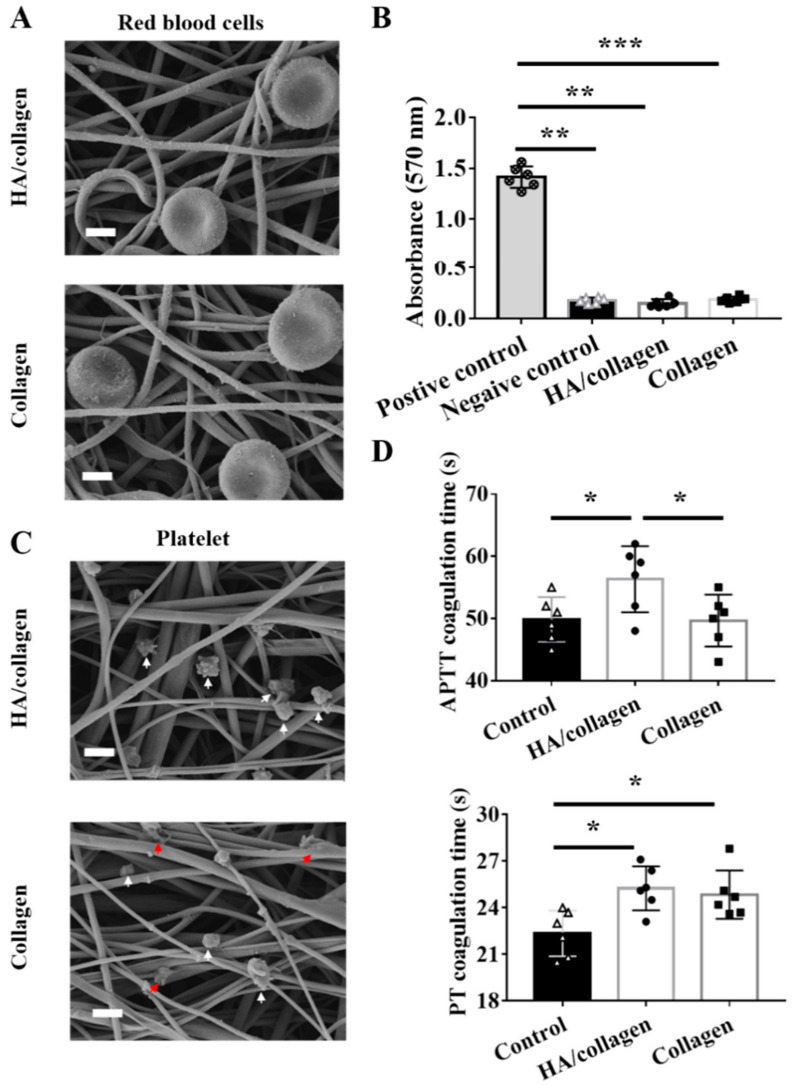
Figure 4.
Hemolysis and anticoagulation tests. Representative SEM micrographs of red blood cells (A) and platelets (C) on HA/collagen and collagen nanofibers after 2 h seeding. White arrows indicate non-adherent platelets, red arrows indicate adherent platelets. Scale bars: 1 µm. Hemolysis rate (B) of different nanofibers. Statistical data of APTT and PT (D) of control native plasma and plasma incubated with different nanofibers. n = 3, * p < 0.5; ** p < 0.01; *** p < 0.001.

