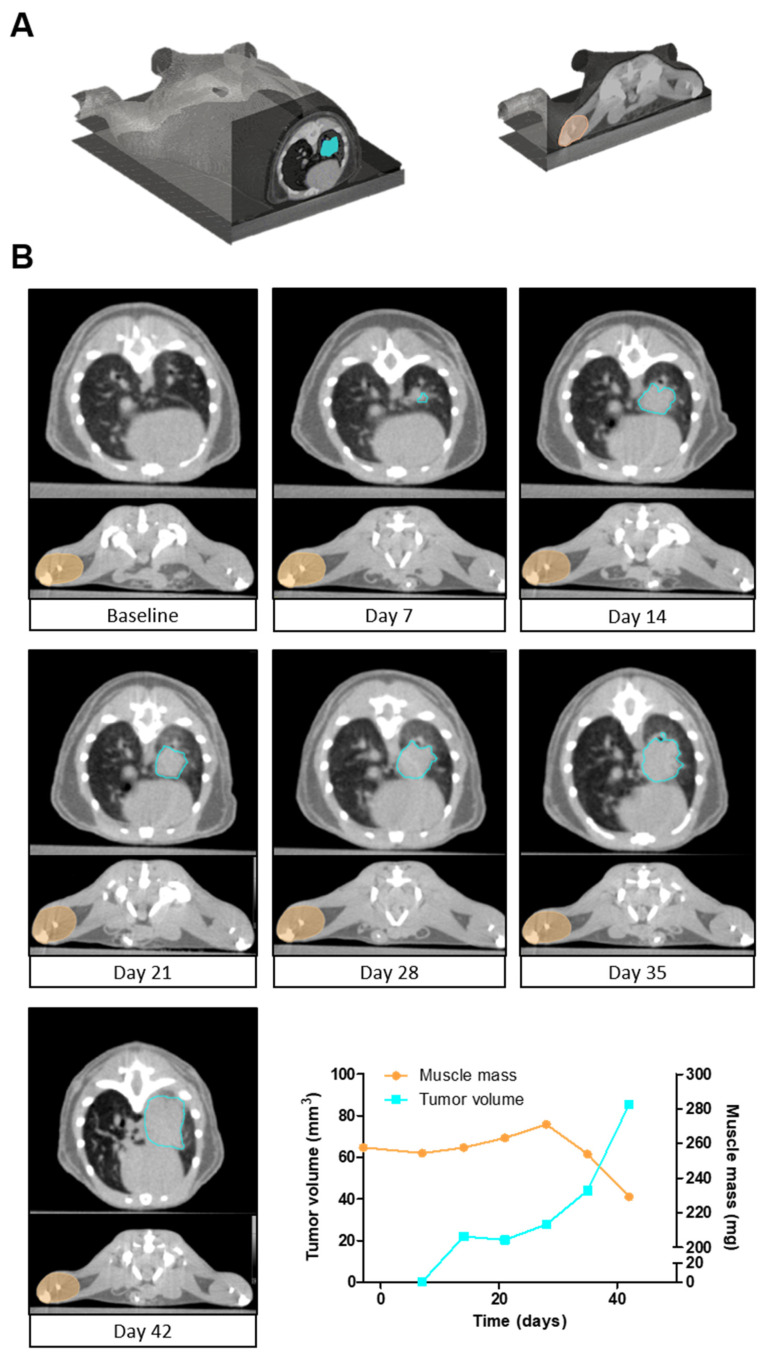
Figure 4.
Longitudinal follow-up of tumor volume and muscle mass. (A) A 3D image of a whole-body mouse µCBCT scan indicating the region of the axial slices selected for (B). (B) A series of axial slices of µCBCT images illustrating the automatic lung tumor segmentations (light blue) and lower hind limb muscle complex segmentations (orange). The µCBCT images represent one mouse at seven different time points. The quantified tumor volumes (light blue) and muscle masses (orange) are presented over time in the line graph.

