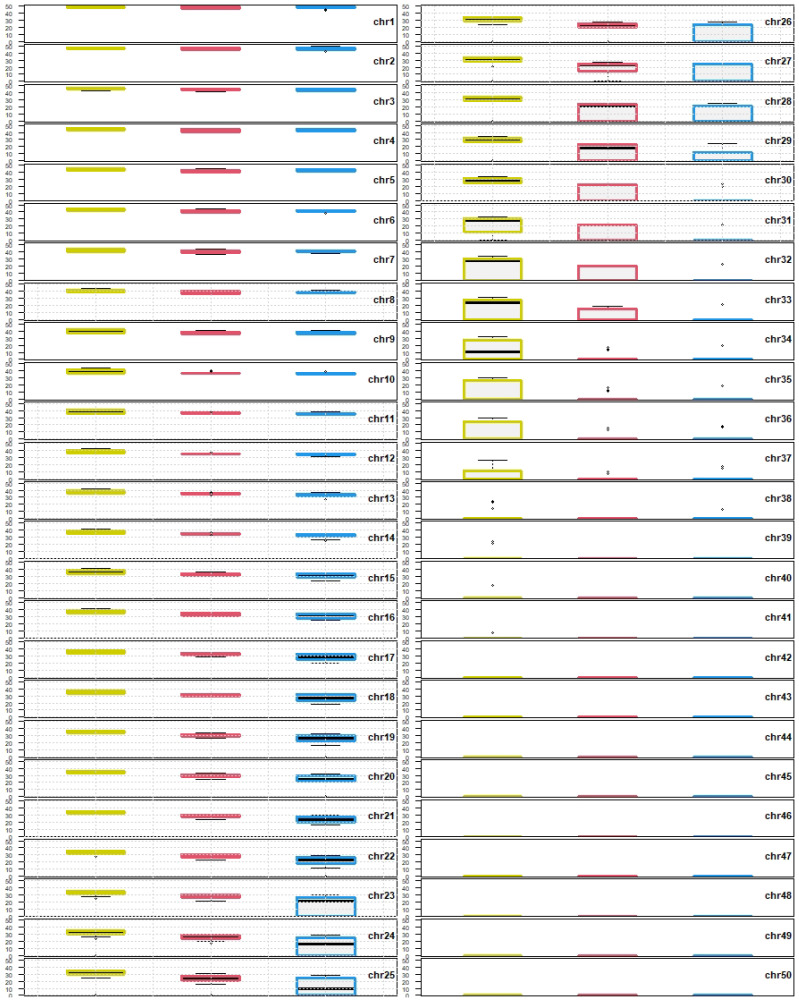
Figure 3.
Box plots composed of orthologous chromosomes of each species. Chromosomes are ordered decreasingly according to the i value. Chromosomes on the top left of the figure are the most metacentric, chromosome 1 (chr1), chromosomes on the bottom right of the figure are the most telocentric (chr50). Yellow, red and blue boxes represents C. auratus, C. carassius and C. gibelio, respectively. Each chromosome is linked to i value (y axis). Upper () and lower () whiskers show extreme values, boxes involve and group of values. The black line within boxes indicates value of the dataset (). Outliers (errors) are drawn as black points. The grid in some box plots represents significantly different i values within the – range. Box plots without the grid share some i values within the – range.

