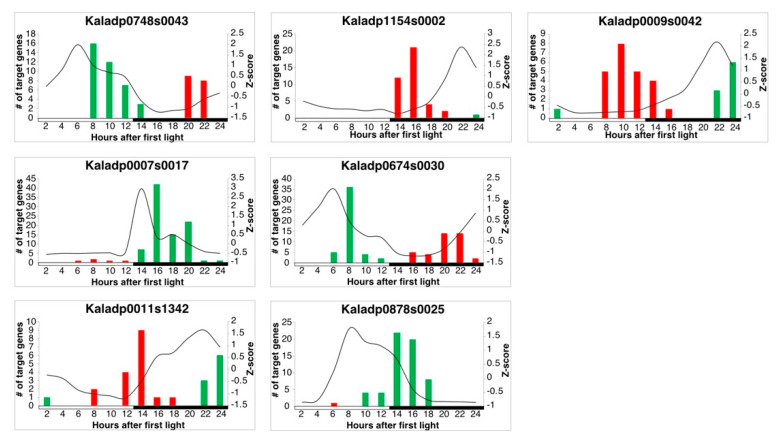
Figure 5.
Gene expression profiles of Kalanchoë fedtschenkoi candidate core clock transcription factors and phase calls of their respective targets. The black lines represent the z-score standardized expression profile of the respective gene. Red and green bars represent the number of predicted target genes phases to the same time of day. Red bars signify that the target genes are repressed by the respective regulator and green bars signify that the target genes are activated by the respective regulator. White and black bars indicate daytime (12-hour) and nighttime (12-hour), respectively.

