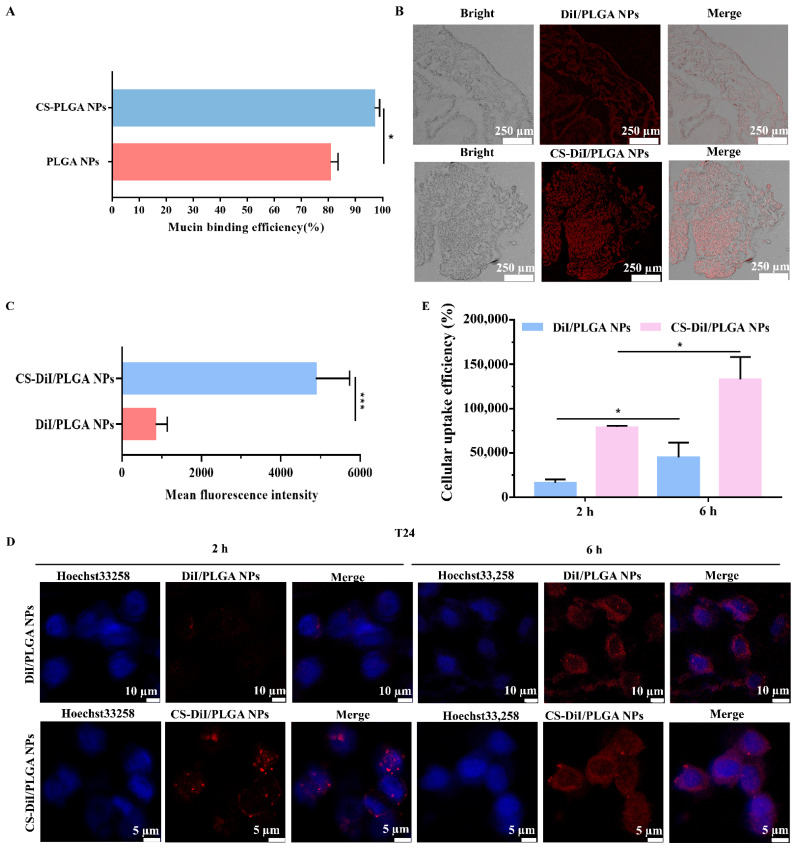
Figure 6.
Determination of NPs adhesion and uptake ability. (A) Binding efficiency of mucin to NPs in vitro. Values represent the mean ± SD (n = 3). Statistically significant differences with PLGA NPs are marked with (*) for p < 0.05. (B) Adhesion of NPs in the mouse bladder in vivo. (C) The percent surface coverage by NPs on the bladder mucosa surface was quantified as the mean fluorescence intensity ± SD. (D) Cellular distribution of DiI/PLGA NPs and CS-DiI/PLGA NPs in T24 cells after 2 and 6 h of incubation was observed by CLSM. Confocal images of T24 cells after incubation with DiI/PLGA NPs and CS-DiI/PLGA NPs (red). Cells were labeled with Hoechst 33258 (blue) to stain the nucleus. The scale bar is 5 and 10 µm, respectively. (E) Cellular uptake efficiency of DiI/PLGA NPs and CS-DiI/PLGA NPs by T24 cells. Data represent the mean ± SD (n = 3). * p < 0.05, *** p < 0.001 compared to the control.

