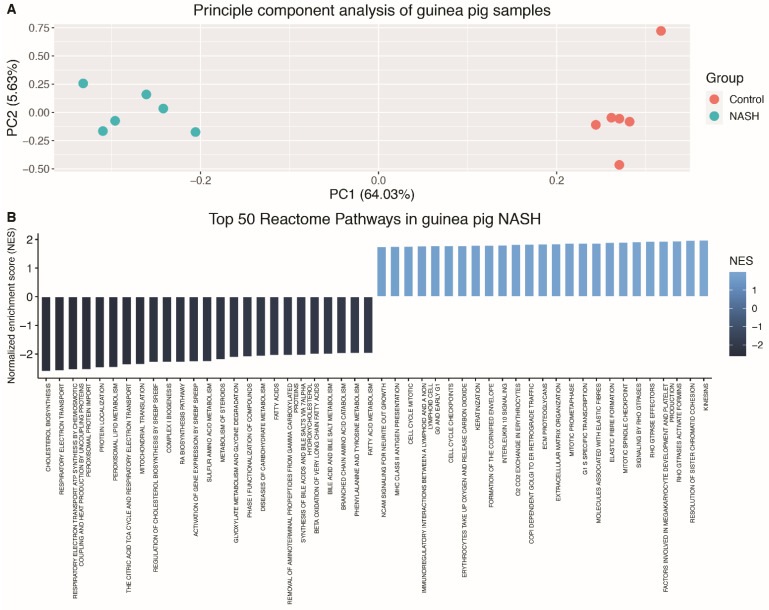
Figure 2.
Principal-component analysis and top 50 dysregulated pathways in guinea pigs with NASH (A) Principal-component analysis plot of guinea pig samples. NASH and control animals clearly separated on the basis of all genes by PC1 explaining 64.03% of the total data variance. (B) Top 50 reactome pathways obtained from GSEA in guinea pigs with NASH vs. healthy controls. Top 50 pathways included the 25 most upregulated and the 25 most downregulated pathways. All pathways were selected on the basis of corrected Benjamini–Hochberg p-values and normalised enrichment score. PC: principal component, NASH: non-alcoholic steatohepatitis, NES: normalised enrichment score.

