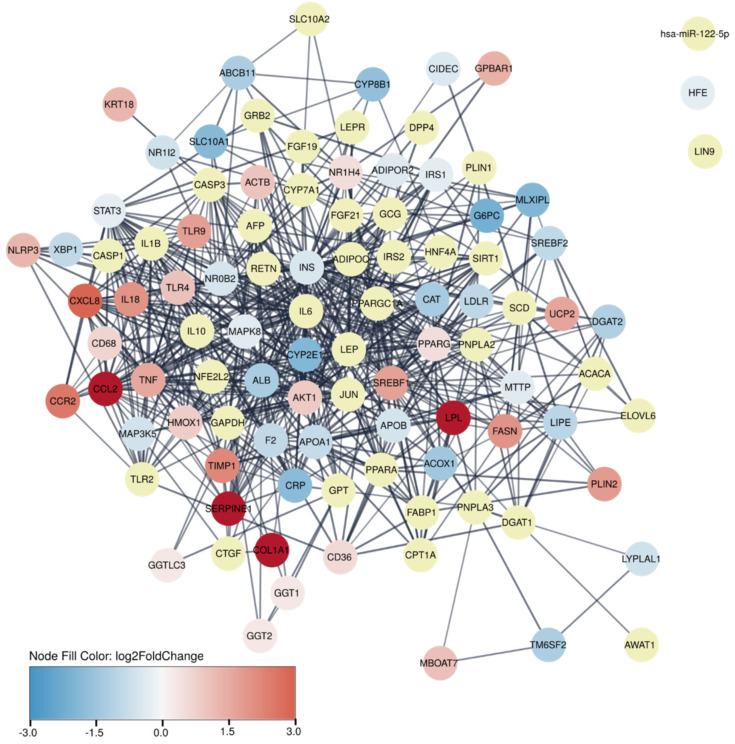
Figure 3.
Protein–protein association network showing top 100 genes most strongly associated with human NASH. Yellow nodes indicate 40 proteins that are not differentially expressed in guinea pig NASH. Remaining network nodes are coloured by log2 fold changes of differentially expressed genes in guinea pigs using the default Cytoscape colour gradient blue–white–red of log2 fold change from −3 to 3.

