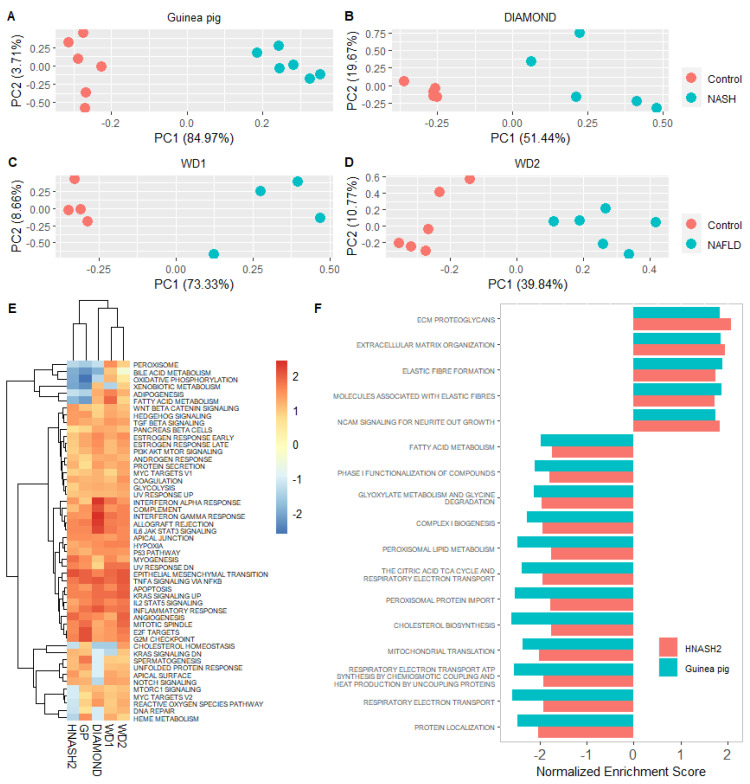
Figure 5.
Comparison of preclinical models and patients with advanced NASH. (A–D) Principal-component analysis using top 200 differentially expressed genes from HNASH2 (NASH patients with advanced vs. mild fibrosis) could separate NASH/NAFLD from healthy controls in all included preclinical models. Differentially expressed genes from HNASH2 dataset selected on the basis of q < 0.05 and highest absolute log2 fold change. Principal-component analysis plots depict normalised and transformed values for the 200 genes in each of the animal datasets. (E) Heatmap demonstrating overlap in expression patterns of Hallmark pathways. Heatmap is based on normalised enrichment scores from the gene set enrichment analysis of Hallmark pathways from each dataset. Dendrogram depicts hierarchical clustering of groups according to normalised enrichment scores. Colour bar indicates normalised enrichment scores for each gene set. Blue indicates a downregulated gene set, whereas red indicates an upregulated gene set. (F) Overview of normalised enrichment scores of the 17 pathways in common between HNASH2 and guinea pigs. Top 50 pathways of the HNASH2 dataset were compared with the top 50 enriched pathways in guinea pigs. Top 50 pathways included the top 25 most upregulated and the top 25 most downregulated pathways. All pathways were selected on the basis of corrected Benjamini–Hochberg p-values and normalised enrichment scores. WD1 refers to GSE52748, WD2 refers to GSE38141, DIAMOND refers to GSE67680, HNASH2 refers to GSE49451. GP: guinea pig, PC: principal component, NAFLD: nonalcoholic fatty liver disease, NASH: nonalcoholic steatohepatitis.

