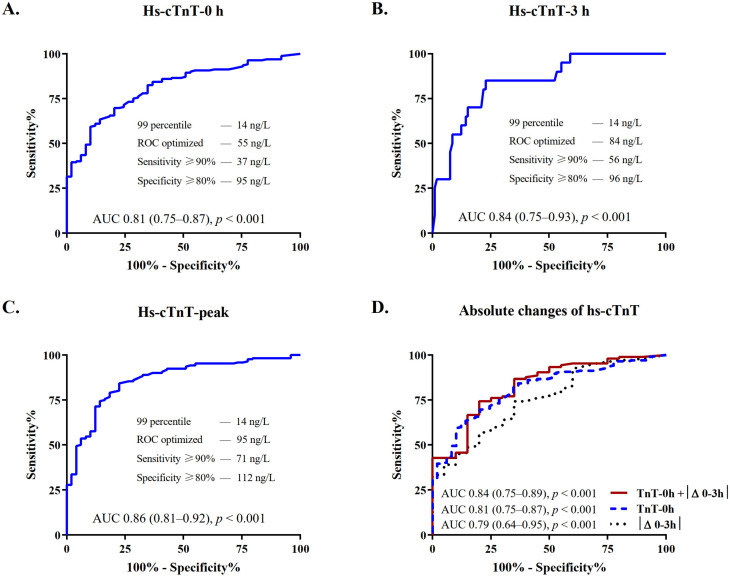
Figure 3.
Diagnostic performance of hs-cTnT at serial sampling in patients with severe CKD. Depicted are ROCs and AUCs with 95% confidence intervals (CI) and predefined levels of sensitivity and specificity, describing the performance of the hs-cTnT assay for the diagnosis of NSTE-ACS requiring revascularization at (A) presentation, (B) 3 h, and (C) peak prior to angiography. (D) Depicts the improvement of the discrimination power of hs-cTnT at presentation when combined with absolute 3 h changes as compared to each of these variables alone. AUC, area under the receiver operating characteristic curve; CKD, chronic kidney disease; hs-cTnT, high-sensitivity cardiac troponin T; ROC, receiver-operating characteristic curve.

