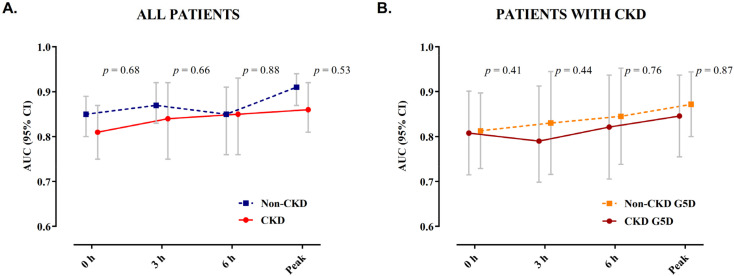
Figure 4.
AUC of hs-cTnT during serial sampling. Depicted are the AUCs with 95% confidence intervals for hs-cTnT during serial sampling at presentation, 3 h, 6 h, and peak prior to coronary angiography in (A) patients with normal renal function and those with severe CKD and (B) among patients with severe CKD, comparing patients with CKD G5D to those with severe CKD but preserved diuresis. AUC, area under the receiver operating characteristic curve; CKD, chronic kidney disease; CKD G5D, chronic kidney disease G5 treated by dialysis.

