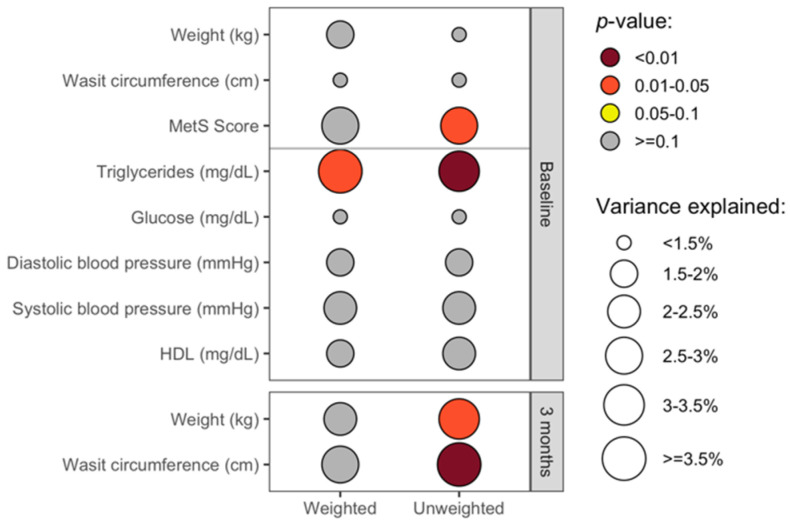
Figure 4.
Cross-sectional associations between the gut microbiota and clinical health measures. This plot shows the cross-sectional associations between clinical health measures and the overall gut microbiota composition at baseline (upper panel; n = 56) and three months (lower panel; n = 55) based on permutational ANOVA models, controlling for age and sex, as well as intervention group for analyses of data from three months. The color shows the p-value for the association, and the size of the circles represents the amount of variation explained (R2) in the overall gut microbiota composition as quantified by weighted (left) and unweighted (right) UniFrac metrics. While numerous clinical measures were collected at baseline, including all of the components of MetS, weight and waist circumference were the primary clinical measures collected at three months.

