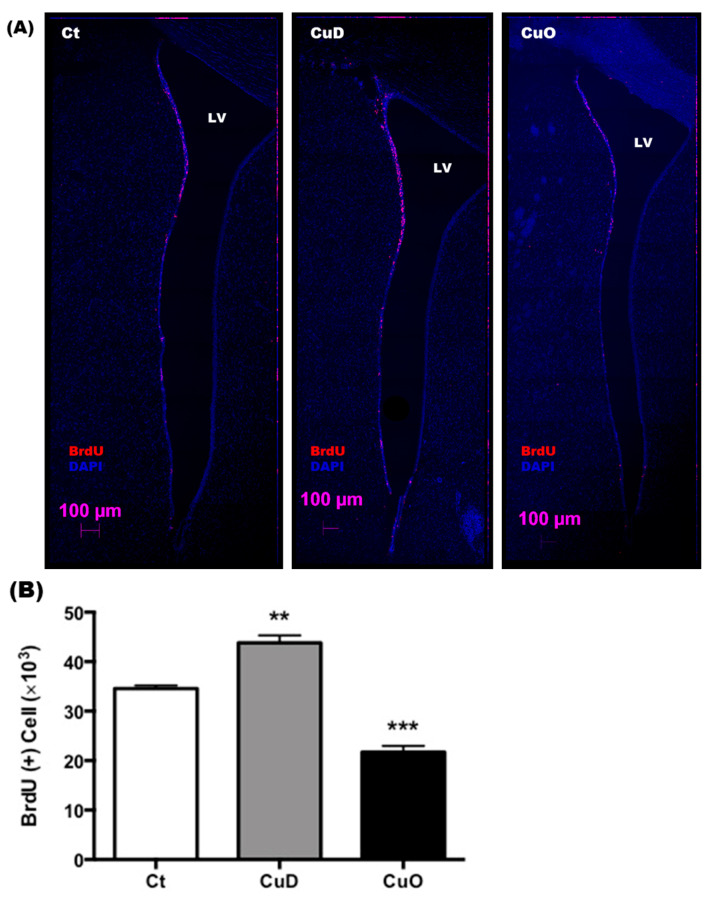
Figure 5.
Confocal imaging study of proliferating NPSCs in the SVZ following CuD or CuO treatment. (A). Representative confocal images of the left coronal SVZ with BrdU (red signal)/DAPI (blue signal) staining. Scale bar = 250 µm. (B). BrdU(+) cell counts in the SVZ. Data represent mean ± SEM, n = 3–4/group. **: p < 0.01, ***: p < 0.001, as compared with the correspondent Ct group; using one-way ANOVA analysis.

