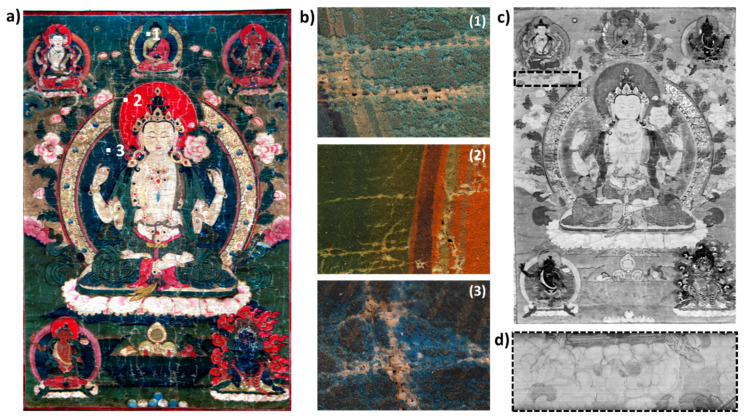
Figure 2.
(a) RGB image reconstructed from VIS-RIS dataset (red channel is assigned to 639.1 nm, green to 550.6 nm, and blue to 460.6 nm) of the historical tangka analyzed (size: 70 × 120 cm2). Three blue and green areas are located that refer to: (b) macro-photographs of three locations highlighting intrinsic mixture of blue and green particles, and surface degradation; (c) short-wave infrared imaging data at 1650 nm that reveals (d) the underlying preparatory drawing and contour of a floral shape, located using dashed rectangle in (c).

