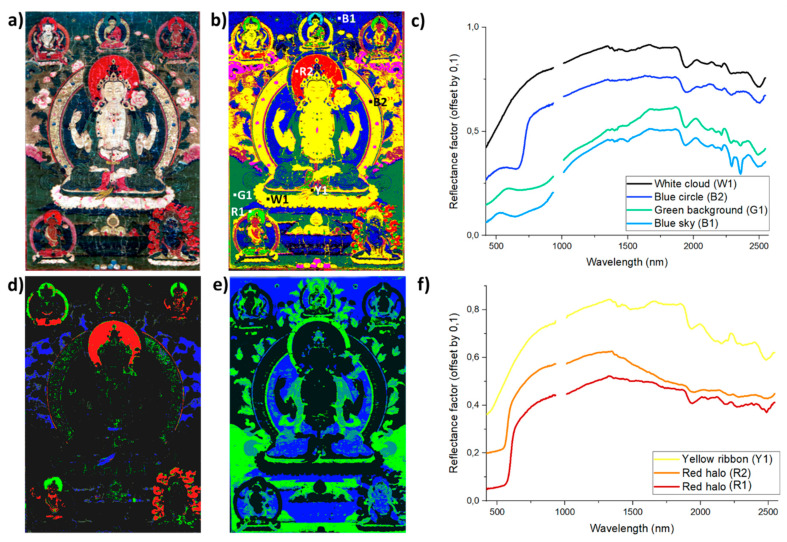
Figure 3.
(a) Visible picture of the historical tangka analyzed; (b) SAM classification of VIS-RIS dataset (red: minium, blue: azurite, light green: vermilion, dark green: malachite, pink: indigo, brown: organic lake—tolerance angle 0.15 rad) with analyzed sites and corresponding reflectance spectra presented in (c,f); DNN model results for (d) minium, vermilion, orpiment (in red, green and blue, respectively) and (e) azurite and malachite (in blue and green, respectively).

