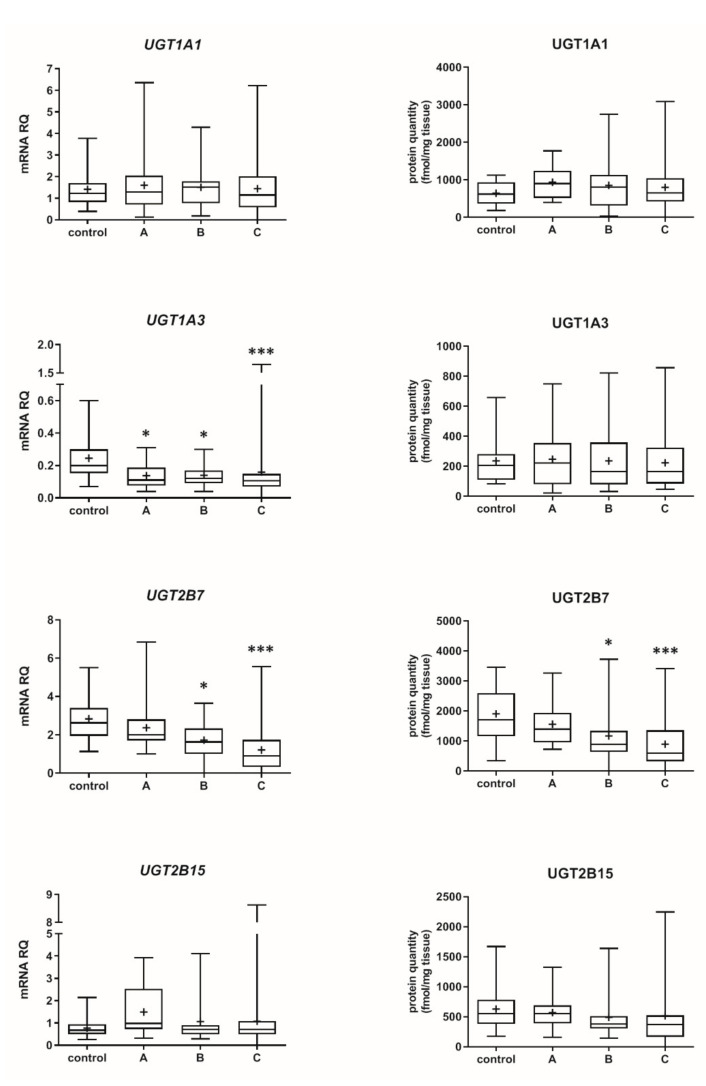
Figure 2.
Gene expression (left) and protein abundance (right) of UGTs in hepatic tissues stratified according to the Child–Pugh score into stages: A (n = 18), B (n = 31) and C (n = 28). The data are represented as box-plots of the median (horizontal line), 75th (top of box), and 25th (bottom of box) quartiles, the smallest and largest values (whiskers) and mean (+) are shown. mRNA levels of the analyzed genes were expressed as relative amounts to the mean of five housekeeping genes (GAPDH, HMBS, PPIA, RPLP0, RPS9). Statistically significant differences: * p < 0.05, *** p < 0.001 (Kruskal–Wallis test post hoc Dunn’s test with Bonferroni correction) in comparison to the controls.

