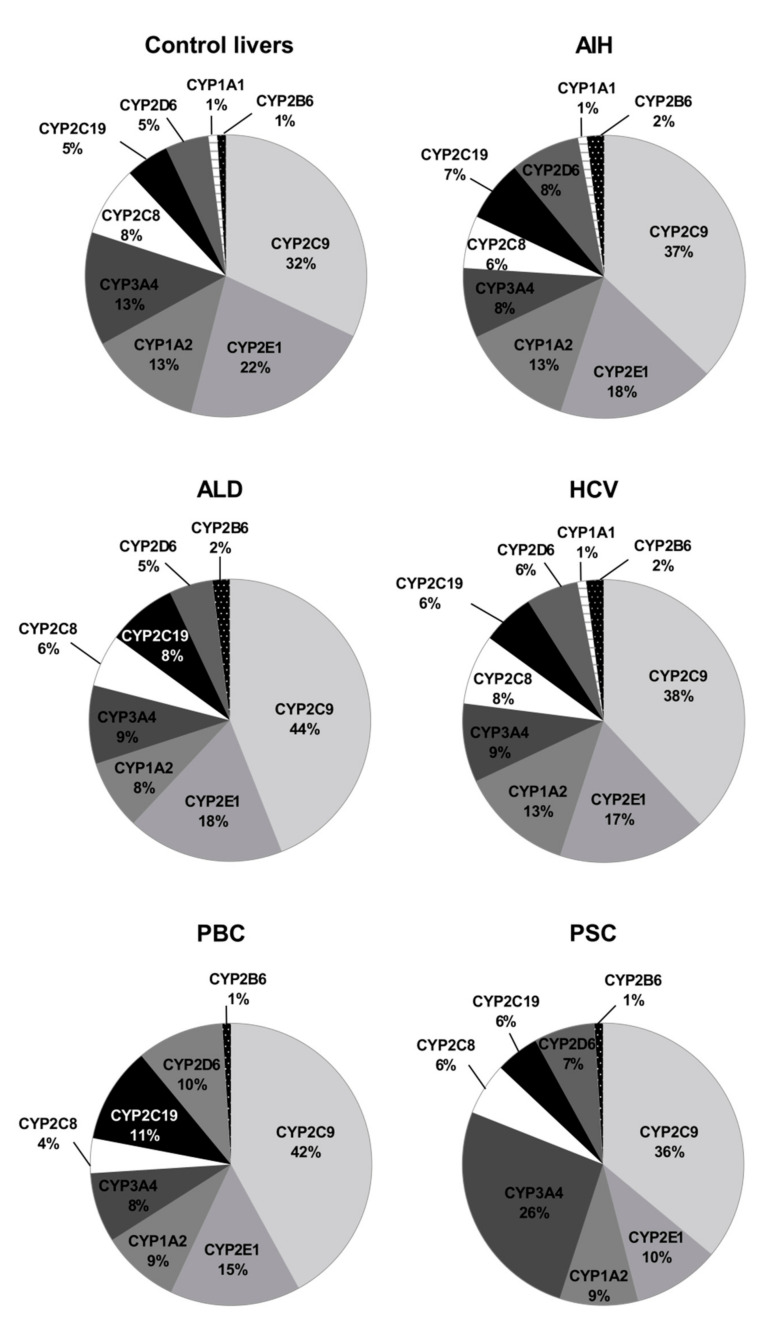
Figure 6.
The pie chart of the individual enzyme proteins in livers tissues from hepatitis C (HCV), primary biliary cholangitis (PBC), primary sclerosing cholangitis (PSC), alcoholic liver disease (ALD) and autoimmune hepatitis (AIH) patients and the controls. The pie charts show the abundance of each enzymatic protein as a percentage of the sum of all enzyme proteins abundance.

