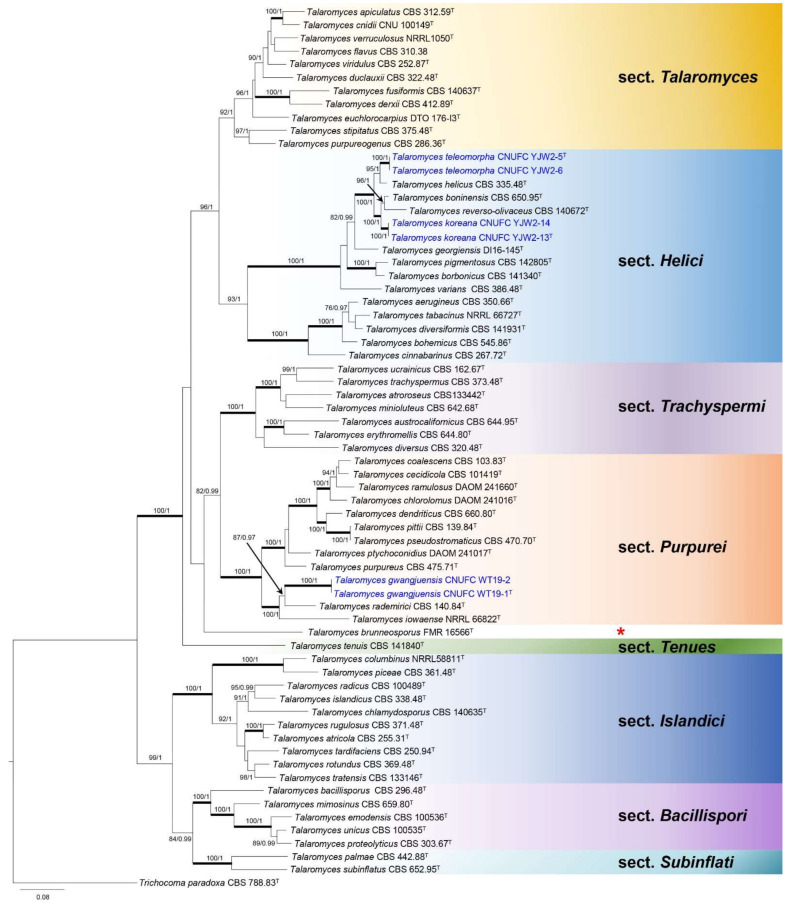
Figure 1.
Phylogram generated from the Maximum Likelihood (RAxML) analysis based on the combined ITS, BenA, CaM, and RPB2 sequences data of Talaromyces. The red asterisk represents a separate lineage which is not assigned yet. The branches with values = 100% ML BS and 1 PP are highlighted by thickened branches. The branches with values ≥70% ML BS and ≥0.95 PP indicated above or below branches. Trichocoma paradoxa CBS 788.83 was the group was used as the outgroup. The newly generated sequences are indicated in blue. T = ex-type.

