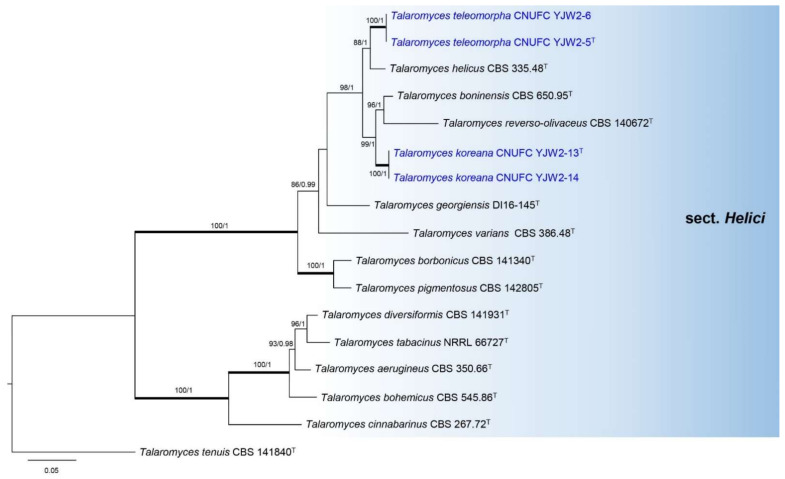
Figure 3.
Phylogram generated from the Maximum Likelihood (RAxML) analysis based on combined the ITS, BenA, CaM, and RPB2 sequence data for the species classified in Talaromyces section Helici. The branches with values = 100% ML BS and 1 PP are highlighted by thickened branches. The branches with values ≥70% ML BS and ≥0.95 PP indicated above or below branches. Talaromyces tenuis CBS 141840 was used as the outgroup. The newly generated sequences are indicated in blue. T = ex-type.

