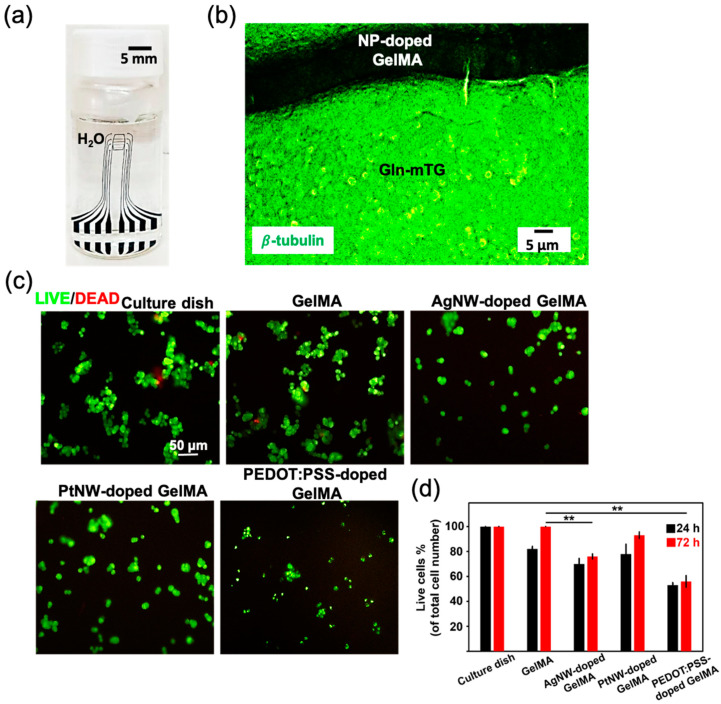
Figure 7.
(a) An optical image demonstrating no morphology change of the hydrogel device. (b) A fluorescence image of PC12 cell differentiation on the hydrogel device after 7 days. (c) Live–Dead assay of the cells was performed after 72 h. (d) Percentage of survived cells as calculated under a fluorescence microscope (* indicates significant difference in different groups for comparison, ** p < 0.01 as compared with GelMA group).

