Figure 6.
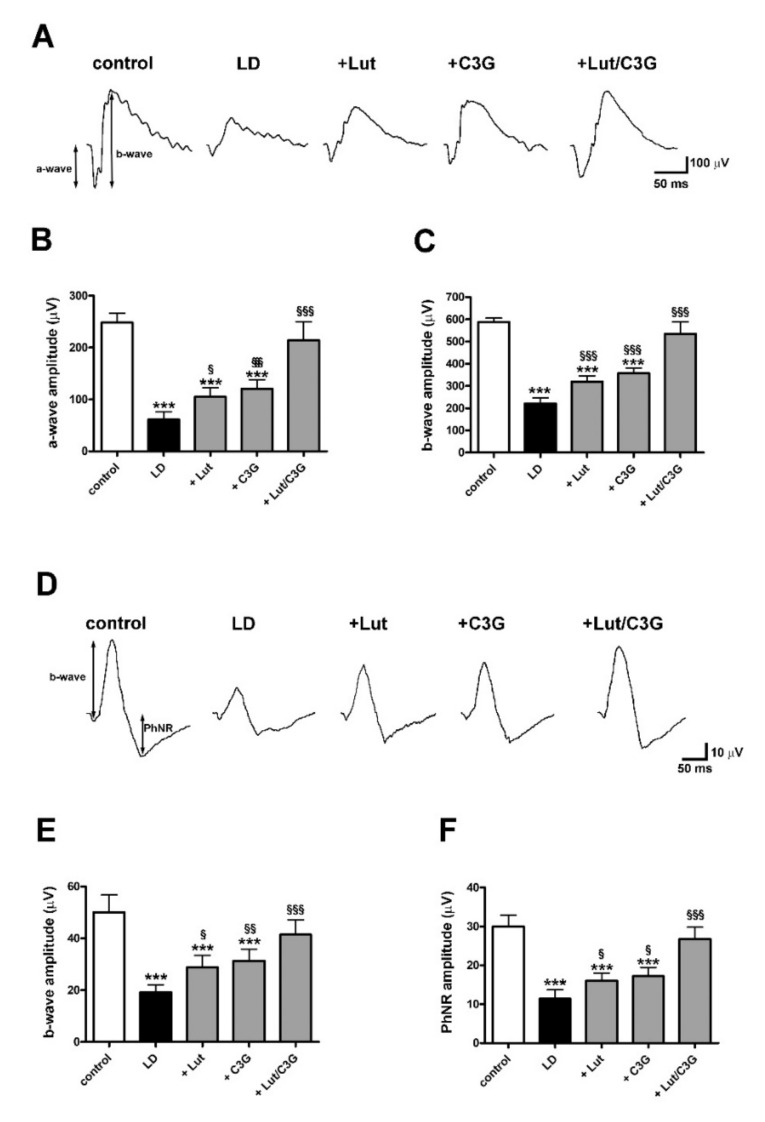
Individual and combined effects of lutein and C3G on scotopic and photopic full field electroretinogram (ERG). (A) Representative ERG waveforms showing scotopic a- and b-waves from control and LD rats untreated or pretreated with either lutein, C3G or their combination. (B,C) Quantitative analysis of scotopic a- and b-wave amplitudes. (D) Representative ERG waveforms showing photopic b-waves and photopic negative response (PhNR). (E,F) Quantitative analysis of photopic b-wave and PhNR amplitudes. Data are expressed as mean ± SD. Differences between groups were tested for statistical significance using one-way ANOVA followed by the Newman–Keuls multiple comparison post hoc test (n = 6 animals per group). *** p < 0.001 versus control; § p < 0.05; §§ p < 0.01; §§§ p < 0.001 versus LD.

