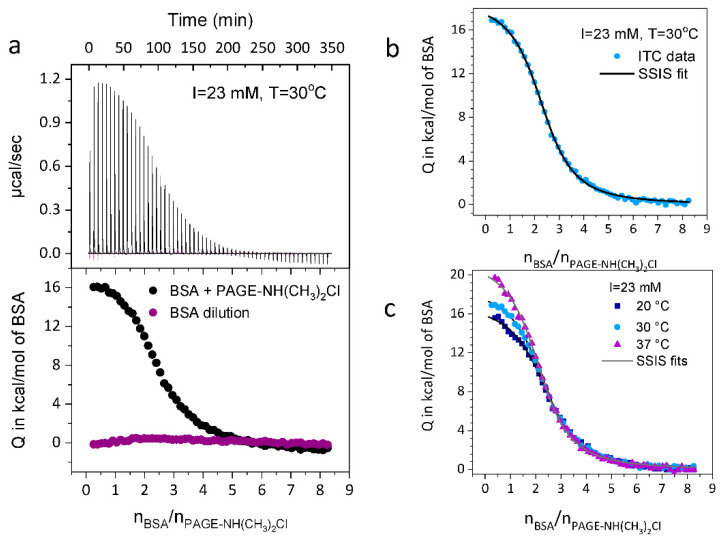
Figure 2.
ITC-analysis exemplified for polymer 4. (a) Top panel: the raw data from the titration of BSA to PAGE-NH(CH3)2Cl (black spikes) along with the raw dilution curve of BSA by buffer (purple spikes) at T = 30 °C and I = 23 mM. Lower panel: the integrated heats of each injection. (b) The respective SSIS-fits of curves obtained at T = 30 °C and (c) T = 20, 30 and 37 °C. The thermodynamic data derived from these fits are gathered in Table S6.

