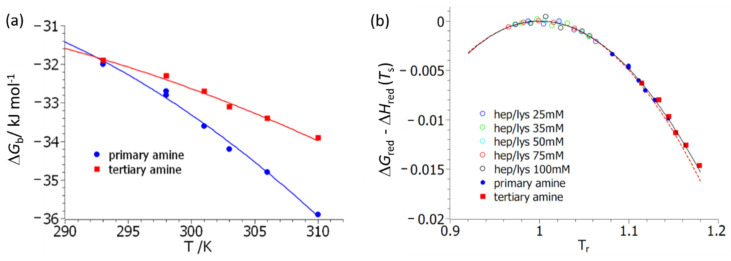
Figure 3.
Analysis of the free energy, ΔGb, of complex formation between BSA and polymers 3 (primary amine) and 4 (tertiary amine), respectively, according to Equations (7) and (10a). (a) Fits of Equation (7) to experimental data. The parameters obtained from this fit are gathered in Table 1. (b) Analysis of the data in terms of the master curve Equation (10a). The reduced free energy of binding, ΔGred, is plotted against the reduced temperature, Tr = T/Ts. The solid line denotes the exact results, whereas the dashed line displays the series expansion according to Equation (11). The hollow points refer to the data obtained for the system heparin/lysozyme studied in [33].

