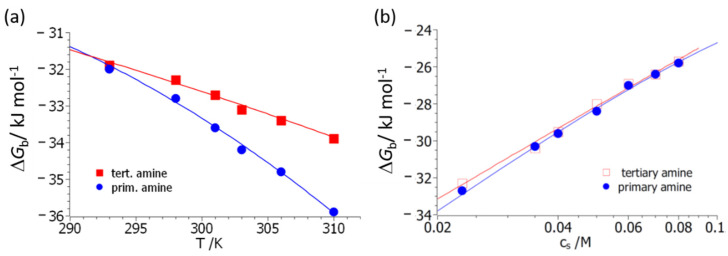
Figure 4.
Comparison of theory and experiment. (a) The free energy of binding, ΔGb, is plotted against the temperature for polymers 3 (primary amine) and 4 (tertiary dimethyl amine). The salt concentration was fixed at cs = 23 mM for all data. (b) The free energy of binding, ΔGb, is plotted against the salt concentration, cs, at a fixed temperature of 298 K for polymers 3 (primary amine) and 4 (tertiary dimethyl amine). The solid lines mark the fit by Equation (14) in both figures.

