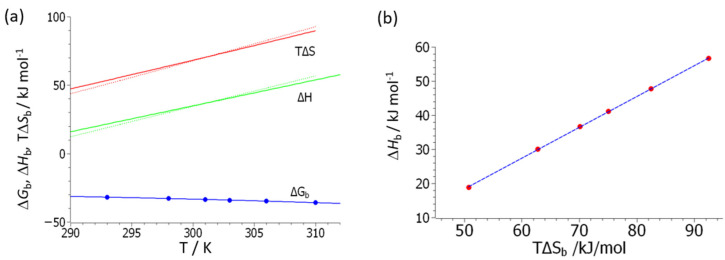
Figure 5.
Enthalpy–entropy compensation for the data obtained from polymer 3 (primary amine). (a) The blue circles denote the measured free energy of binding, whereas the blue solid line gives the respective fit by Equation (14). The solid green and red lines give the enthalpy Equation (15) and the entropy multiplied by T as obtained from Equation (16), respectively. The respective dashed lines denote the enthalpy Equation (4) and the entropy Equation (5) deriving from the fit of Equation (7) to the experimental data. (b) The enthalpy, ΔHb (cf. Equation (4)), obtained from the fit of the experimental data according to Equation (7) is plotted against TΔSb (Equation (5)). The slope of the dashed line is 0.9, indicating an incomplete compensation of enthalpy by entropy. See text for further explanation.

