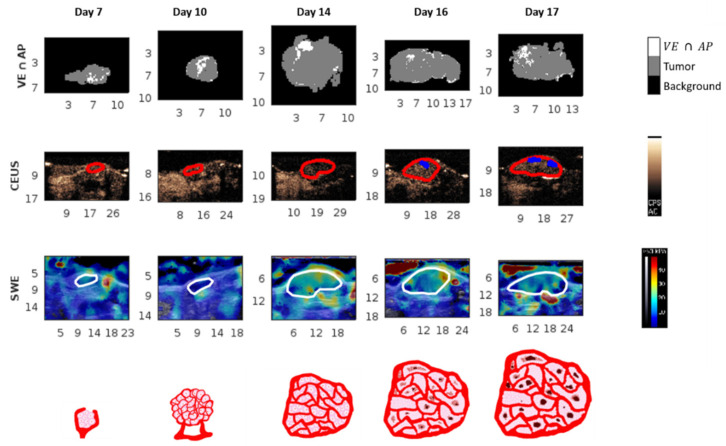
Figure 3.
Example of a parametric map over time. Each column (day) shows data from the same tumor. Scales at the border of images are in millimeters. The first row is a representation of the immunohistological images of co-localization of a high percent area of the vascular endothelium and apoptosis (VE ∩ AP). The second row is a snapshot of the CEUS sequence with the tumors outlined in red and the nonperfused zones in blue. The third row is the SWE parametric map with the tumors outlined in white. The fourth row represents an illustration of the biological tumor state at the tumor cell and vascular level.

