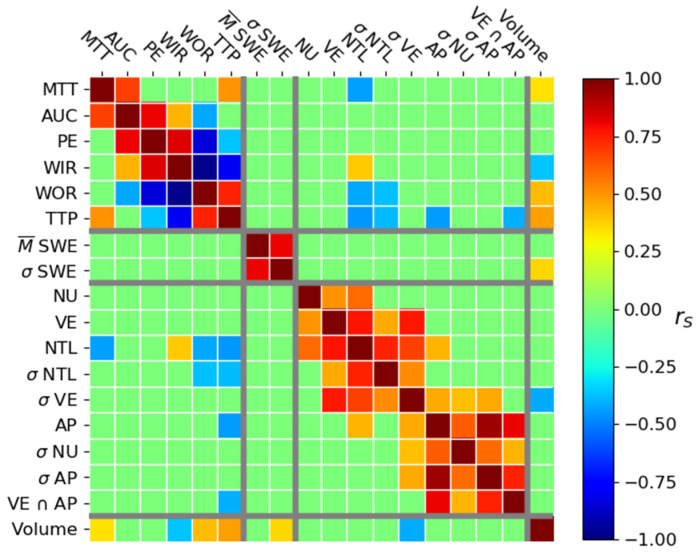
Figure 4.
Spearman correlation coefficient value between the CEUS parameters (Mean Transit Time (MTT), Area Under the Curve (AUC), Peak Enhancement (PE), Wash-In Rate (WIR), Wash-Out Rate (WOR), and Time to Peak (TTP)), SWE parameters, histological parameters (percent area occupied by nuclei (NU), the number of T Lymphocytes per mm² (NTL), the percent area of apoptosis (AP), and percent area of vascular endothelium (VE), and co-localization of a high VE and AP (VE ∩ AP)), and tumor volume. Only significant correlations are shown (p < 0.05).

