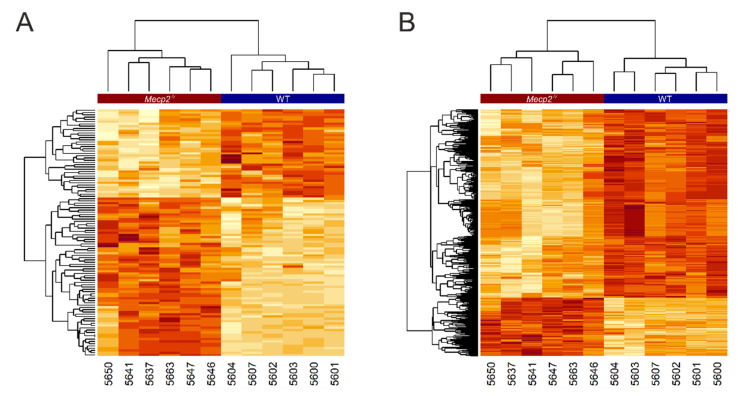
Figure 3.
Heatmaps representing the concentration values of all deregulated identified/non-identified metabolites. Dark red indicates higher values and white lower values. Measurements are arranged in rows and the tissue samples are represented in columns. The Mecp2−/y and WT samples are labeled at the top of the heatmap by a red and blue banner, respectively. Dendrograms are included showing the clustering of both measurements and unique sample identifiers (individual mouse numbers). The heatmaps were computed for the identified metabolites (A) and for all measurements (B).

