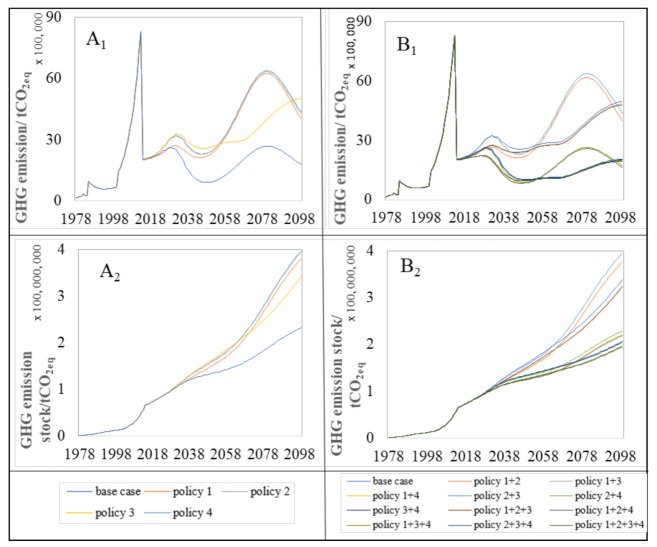
Figure 9.
Trend of annual and stock of GHG emission for base case and proposed policy measures. A1 and B1 represent the impact trend of single policy and complex policy on GHG emission, respectively. A2 and B2 are the impact trend of single policy and complex policy on GHG emission stock, respectively.

