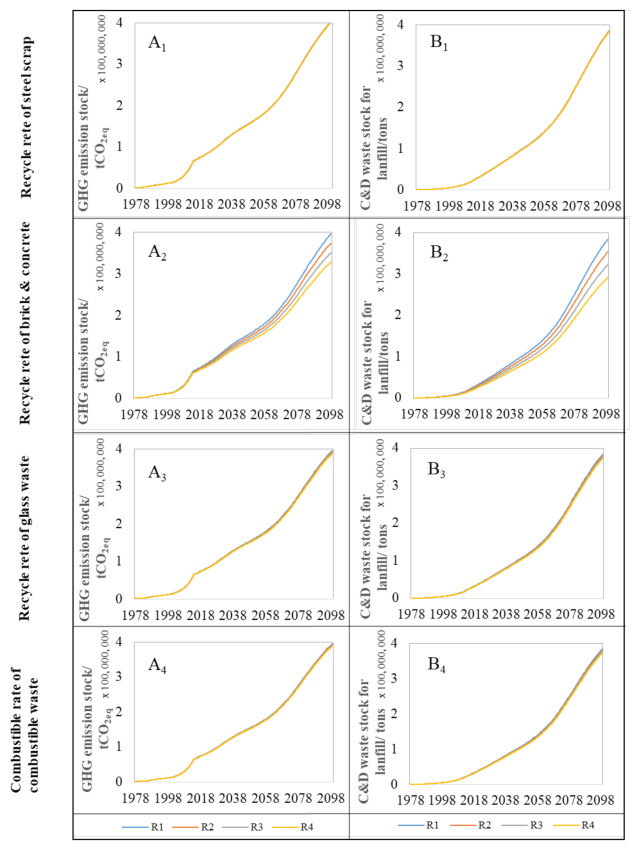
Figure 11.
The simulation of the sensitive analysis. A1, A2, A3 and A4 represent the impacts of different recycle rate of scrap steel, different recycle rate of brick & concrete, different recycle rate of glass waste and different combustible rate of combustible waste on GHG emission stock. B1, B2, B3 and B4 represent the impacts of different recycle rate of scrap steel, different recycle rate of brick & concrete, different recycle rate of glass waste and different combustible rate of combustible waste on C&D waste stock for landfill.

