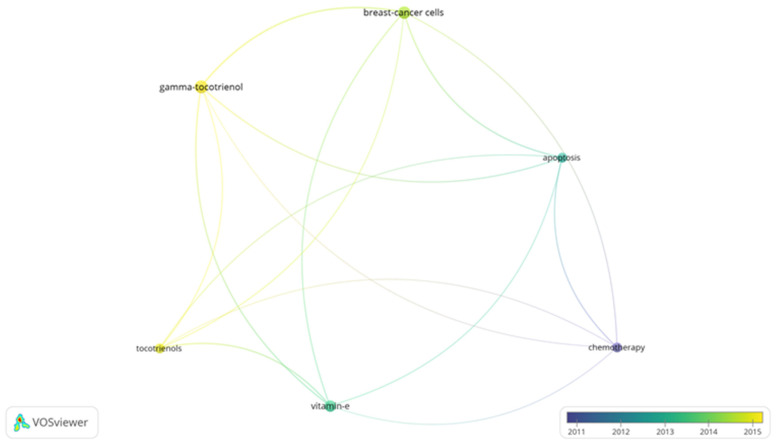
Figure 4.
Term map for years 2011–2015 generated from Search 2. Visualization of 6 terms that occurred a minimum of 5 times in publications. Table S3 lists the visualized terms and their respective occurrences, average year of publication, and average number of citations.

