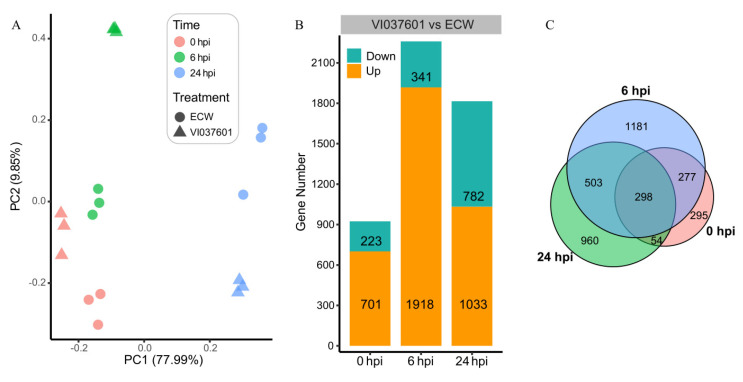
Figure 1.
Transcriptional changes occurred between VI037601 and ECW post Xcv infection. (A) Principal component analysis (PCA) of all 18 RNA-seq samples (three biological replicates per time point) generated from VI037601 and ECW at different time points (0, 6, and 24 hpi) post Xcv infection. Distance between/among samples for PC1 or PC2 directly corresponds to the correlation between/among samples examined. (B) Statistics of differentially expressed genes (DEGs) numbers in VI037601 relative to ECW at three time points (0, 6, and 24 hpi) post Xcv infection. The green color represents down-regulated genes, and the yellow color represents up-regulated genes in VI037601 relative to ECW occurred at each time point post Xcv infection. (C) The Venn plot showing pairwise comparisons of total DEGs that occurred at each time point in VI037601 relative to ECW post Xcv infection. For instance, 298 DEGs were shared at three time points post Xcv infection; 295, 1181, and 960 DEGs specifically occurred at 0, 6, and 24 hpi, respectively, post Xcv infection.

