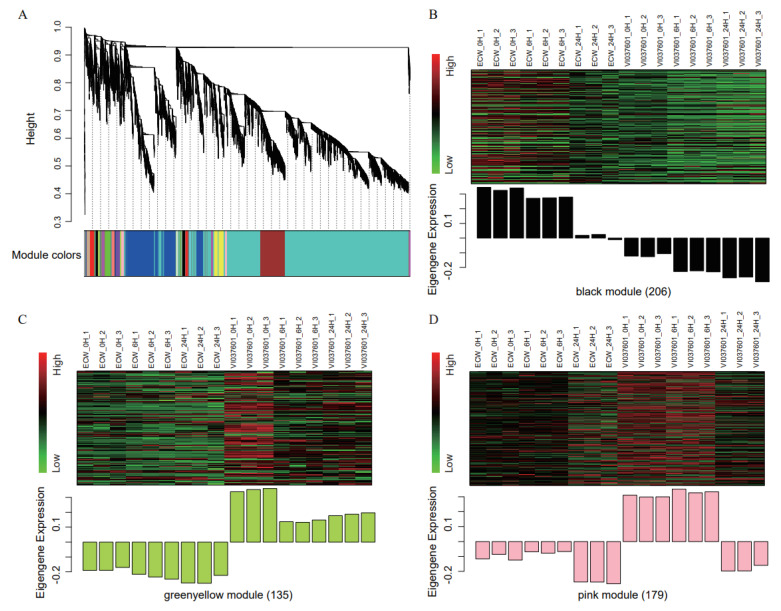
Figure 3.
Construction and identification of co-expression modules. (A) Detection of gene cluster dendrograms and modules. Hierarchical clustering tree (dendrogram) showing coexpression modules identified via the Dynamic Tree Cut method. The major tree branches constitute 18 modules which are labeled with different colors. The genes were clustered on the basis of dissimilarity measure (1-TOM). The branches correspond to modules of highly interconnected genes, each ‘leaf’ (short vertical line) in the tree represents one individual gene. (B–D) Heatmaps showing the expression profiles of co-expressed genes from module black (B), greenyellow (C), and pink (D), bar graphs (below the heatmaps) showing the consensus expression pattern of the coexpressed genes in each module. Red, black, and green represent high, medium, and low expressions, respectively. The number in parentheses (labeled on bottom) represents the number of genes in the module.

