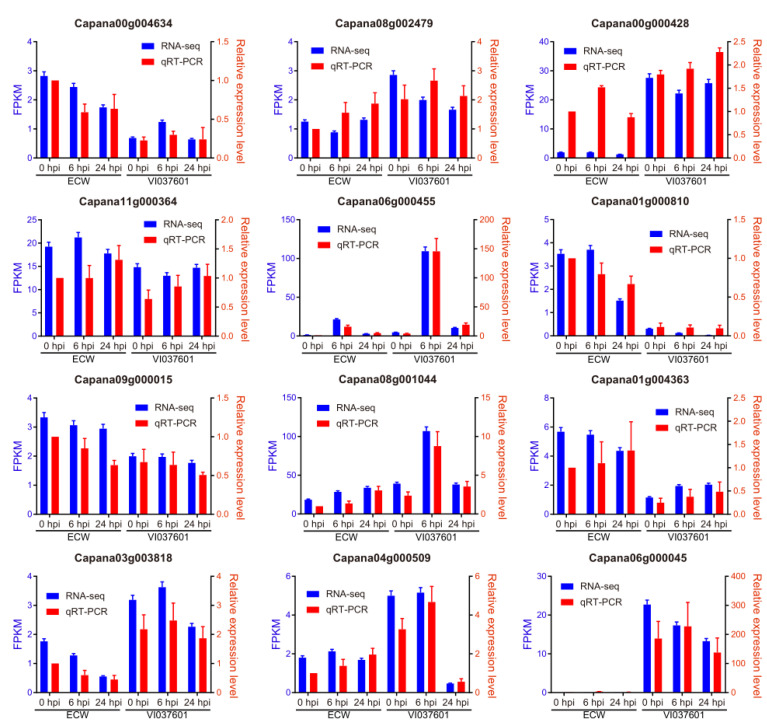
Figure 6.
qRT-PCR validation of some key genes identified in the network. A dual y-axis plot illustrating an in-parallel comparison between RNA-seq (FPKM, blue) and RT-qPCR (relative expression levels, red) of each individual gene examined. The left coordinate (y-axis) with blue represents the FPKM value of RNA-seq, the right coordinate (y-axis) with red represents the relative expression levels of qRT-PCR. The transcript levels of each gene at each time point were normalized relative to the internal control of gene CaUbi3. Relative expression levels of genes examined were calculated and expressed as 2−ΔΔCT relative to the expression levels of the corresponding genes in ECW at 0 hpi, which were set as 1.0. The mean expression levels were calculated from three biological replicates. Error bars are the standard deviations of three biological replicates.

